Creating Zones and Plot Boundaries
Overview of Zone Creation
Before you can calculate metrics, you first need to define zones — the areas or plots over which statistics will be measured. In Solvi, zones are polygon boundaries that represent distinct experimental plots, management zones, or other areas of interest within an Upload or Field.
You can create zones manually, import them from external sources, or generate them automatically using the built-in trial plot tools. Each approach is designed to suit different workflows, from small-scale trials to large research experiments.
Zone Groups and Limits
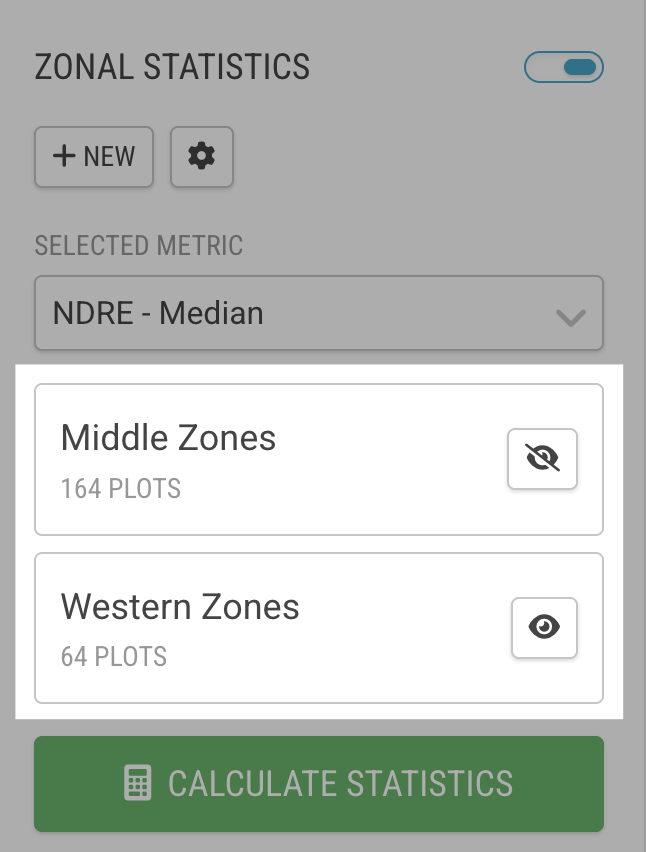
Every time you create zones in an Upload, Solvi places them into a Zone Group. Each Upload can contain multiple Zone Groups, which allows you to manage different trial layouts or separate experiments within the same dataset.
Zone Groups can later be renamed, toggled on and off, or removed entirely. This flexibility makes it easier to compare results between trials or focus analysis on specific subsets of plots.
There is, however, a technical limit: the total number of zones across all Zone Groups in a single Upload cannot exceed 10,000 zones. For most field trials, this is more than sufficient.
Methods for Creating Zones and Plots
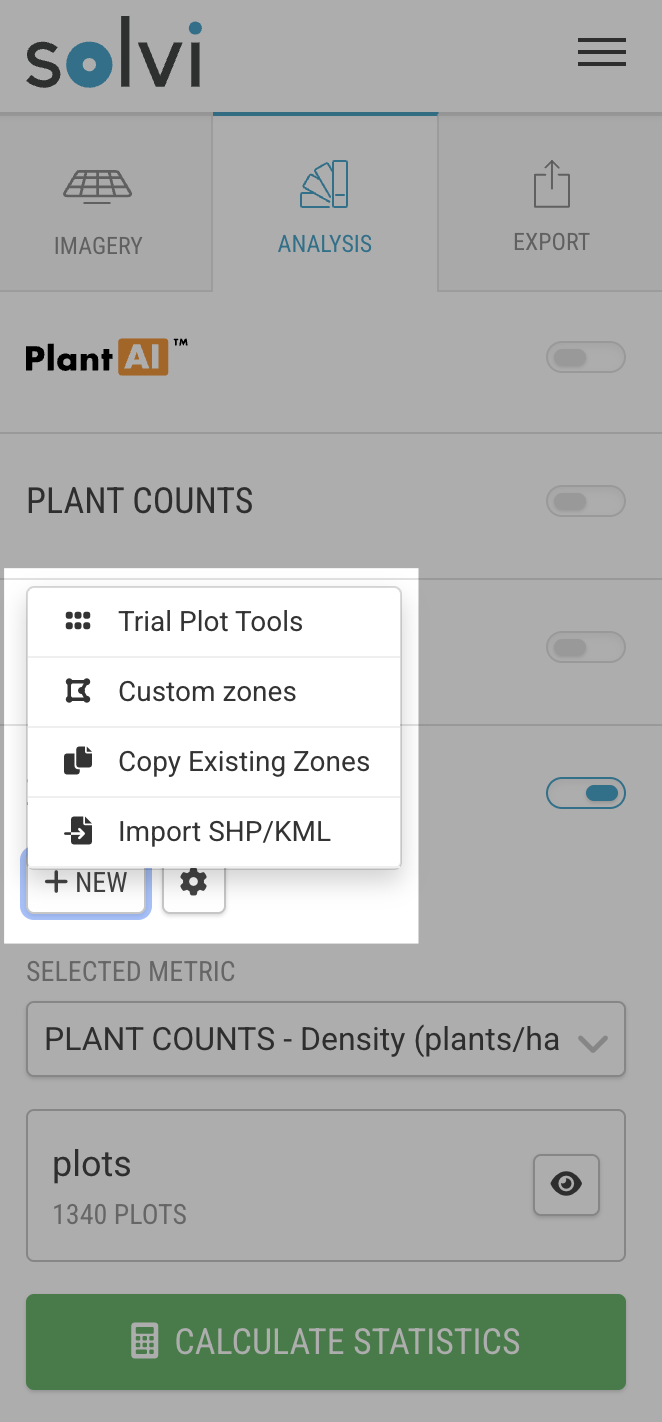
Solvi provides four main ways to create zones, depending on your data and workflow:
1. Import from Shapefile or KML — upload existing plot boundaries created in other GIS or trial management systems.
2. Draw Custom Zones — manually draw zones directly on the map for flexible, irregular layouts.
3. Trial Plot Tools — use built-in tools to automatically detect, generate, or import plots from Excel files; includes options for setting numbering and layout patterns.
4. Copy Existing Zones — reuse plots from another Upload in the same Field when multiple flights have been captured over time.
Each method is covered in detail in the following section.