Methods for Creating Zones and Plots
Solvi provides several ways to create zones or plots within the Zonal Statistics tool. The right method depends on your data source, trial design, and how you intend to analyze results.
Import from Shapefile or KML
If you already have plot boundaries or management zones defined in another GIS or trial management system, you can import them directly.
Click New → Import Shapefile or KML, then select your file.
When importing a Shapefile, make sure to include all required components:
- SHP — geometry
- DBF — attribute table (required if you want to import plot IDs or other attributes)
- PRJ — coordinate system file (required if data is not in WGS84)
You can also compress these into a single .zip file and upload it instead.
Once imported, the polygons will appear as a new Zone Group.
Draw Custom Zones
This option allows you to manually draw zones directly on the map. It’s best suited for larger zones, irregular trial layouts, or when plots differ in size and spacing.
After selecting Custom Zones, you can start drawing polygons to define each zone. Once drawn, you can move, resize, or copy zones as needed. Multiple zones can be selected at once, allowing quick duplication using copy–paste.
When you are satisfied with your layout, click Save to store the new zones. They will appear as a new Zone Group, ready for metric calculation.
Copy Existing Zones
If your Field contains multiple Uploads from different flights, you can reuse previously created plots instead of redrawing them.
Select Copy Existing Zones, and Solvi will show a list of Uploads in the same Field that already contain zones. Choose which set of zones to copy.
This feature works best when all flights are accurately georeferenced — for example, when using drones equipped with RTK GNSS or when Ground Control Points (GCPs) were applied. In such cases, the copied zones will align precisely with the new orthomosaic.
If the zones don't align perfectly, you can adjust them after they've been copied. Click on the group of zones you want to edit, select all zones and drag them alltogether to match the new orthomosaic and then click Save.
Trial Plot Creation Tools
The Trial Plot Creation Tools is an add-on that provides advanced options for quickly creating structured grids of plots used in field trials. These tools are ideal for large experiments with consistent plot spacing and numbering requirements.
You can access them by selecting New → Trial Plot Tools, which presents three options:
Detect Plots Automatically
This option uses an AI-based model to automatically detect plots by analyzing visible gaps between them.
To use it:
- Draw a rough boundary around the entire trial area.
- Click Detect Plots.
The system will process the area and generate polygons for each detected plot.
This method works best when plots are clearly separated by visible gaps — for example, during mid-season when plant canopies don’t yet overlap. It is not recommended for very early or very late growth stages, when plot boundaries are not visually distinguishable.
This method also assumes that the number of plots and gaps between them are consistent across all rows and columns.
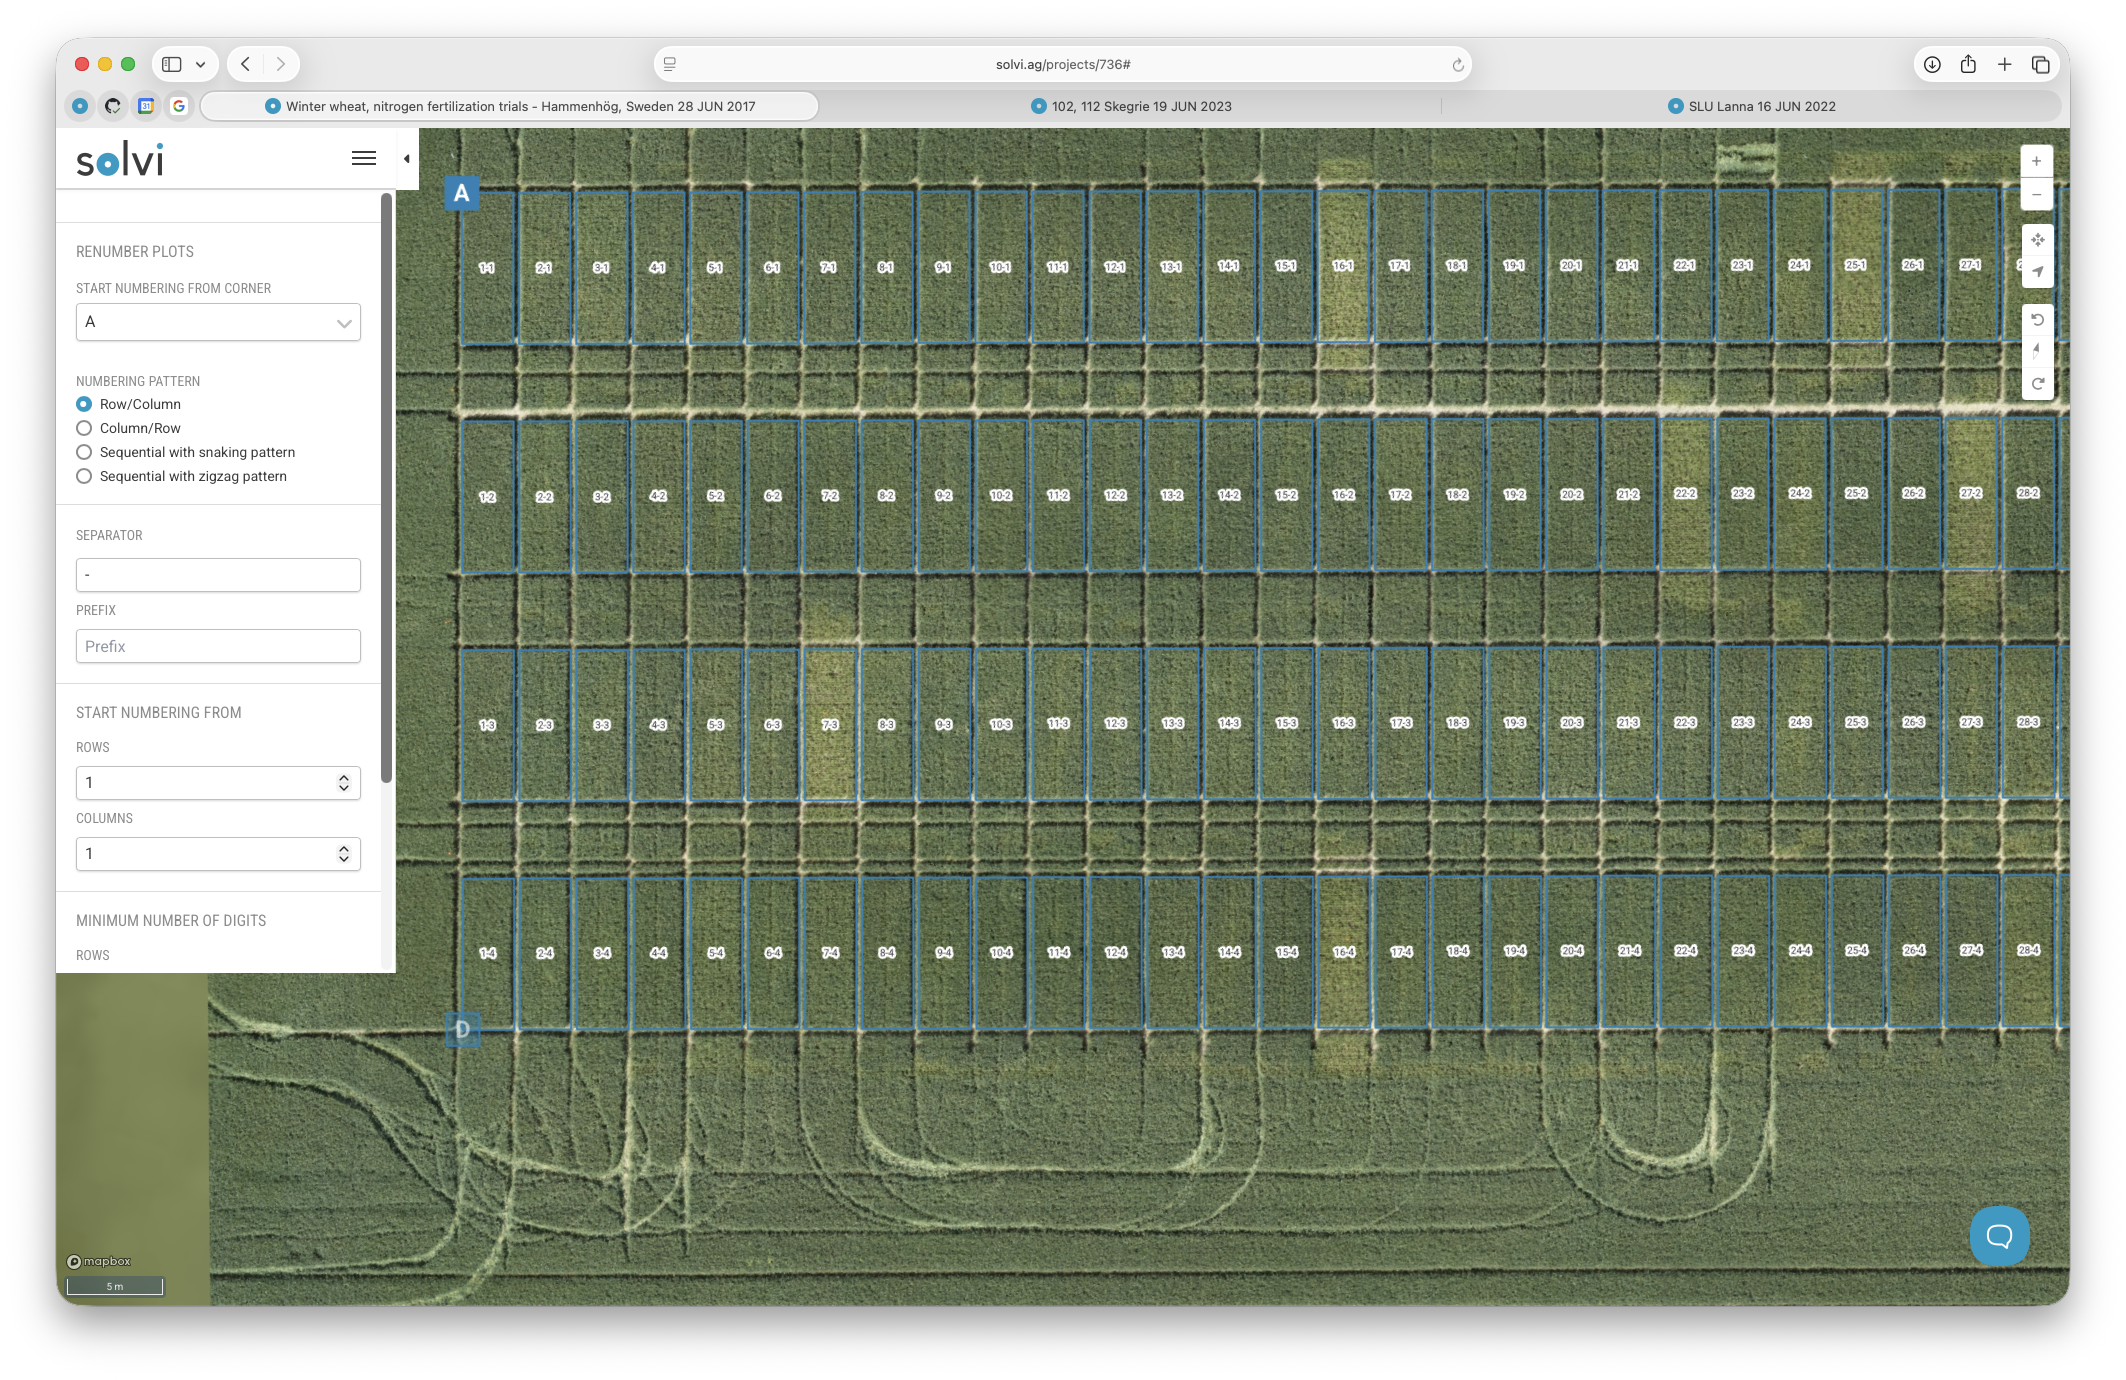
Plot Numbering and Configuration for Automatic Detection
After detection, you can adjust numbering and naming settings:
- Click on the group of plots that has just been detected and then click Renumber
- Choose which corner numbering should start from.
- Select the numbering pattern (e.g., row–column, column–row, or sequential).
- Apply snaking or zigzag patterns for continuous numbering across columns.
- Set the starting number and the minimum number of digits (e.g., four-digit IDs like
0001,0002, etc.).
Once you’re done, click Save to finalize the plots.
Generate Plots Manually
This is the most commonly used option and works well in nearly all field trial scenarios.
- Start by marking the four corners of the trial area. Zoom in to ensure each corner is placed accurately.
- Define which direction corresponds to rows and which to columns.
- You can either:
- Specify plot dimensions and spacing between plots, and let Solvi calculate the number of rows and columns automatically, or
- Enter the number of rows and columns directly, along with spacing, and let Solvi calculate plot dimensions.
- Adjust gaps between rows and columns to ensure that plot boundaries align with visible rows in the imagery but do not extend beyond them.
When you’re satisfied, click Continue to proceed to the numbering setup.
Plot Numbering and Configuration for Generated Plots
Similar to automatically detected plots, you can customize numbering:
- Choose the starting corner for numbering.
- Select between row–column or column–row ordering.
- Use sequential, snaking, or zigzag patterns to control numbering direction.
- Define a starting number (e.g., 1 or 100) and set the number of digits to maintain consistent formatting across all plots.
After saving, the grid of plots will be generated and ready for analysis.
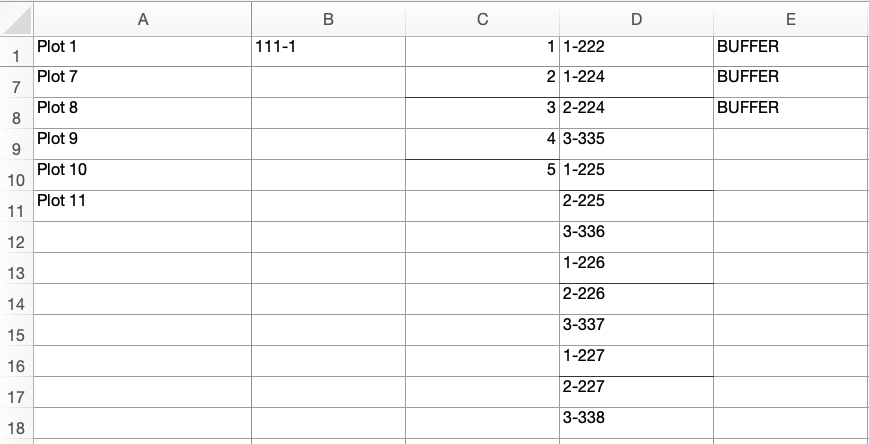
Import Plots from Excel
If you already have a field trial layout defined in Excel — for example, with each cell representing a plot — you can import it directly into Solvi.
Each cell with a value becomes a plot, and that cell’s value is used as the plot ID. This method is useful for irregular layouts or custom numbering schemes.
To use it:
- Click New → Trial Plot Tools → Import from Excel.
- Select your Excel file.
- Mark the four corners of the trial area, just like when generating plots.
- Adjust row and column gaps to align the imported plots with the imagery.
Plot numbering is taken directly from the Excel file, so there’s no need to configure it in Solvi.