Choosing Metrics and Calculating Statistics
Accessing the Settings
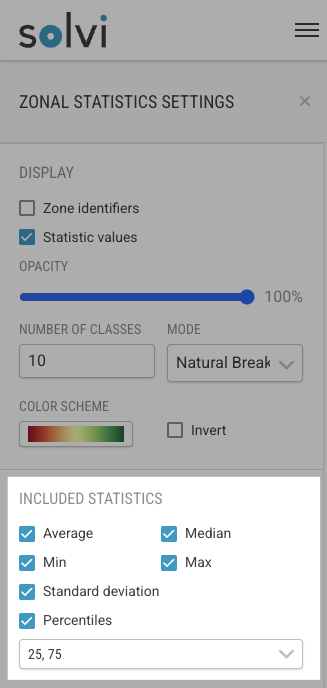
To configure which metrics to calculate, open the Zonal Statistics tool and click the Settings (⚙️) button.
The settings panel contains all available statistical and data layer options. These define what kind of calculations will be performed for each zone or plot.
Available Statistical Measures
You can choose from several standard statistical measures, depending on your analysis needs:
- Average (Mean)
- Median
- Minimum
- Maximum
- Standard Deviation
- Percentiles (from 5th to 95th)
Each selected statistic will be calculated for every zone across the selected data layers.
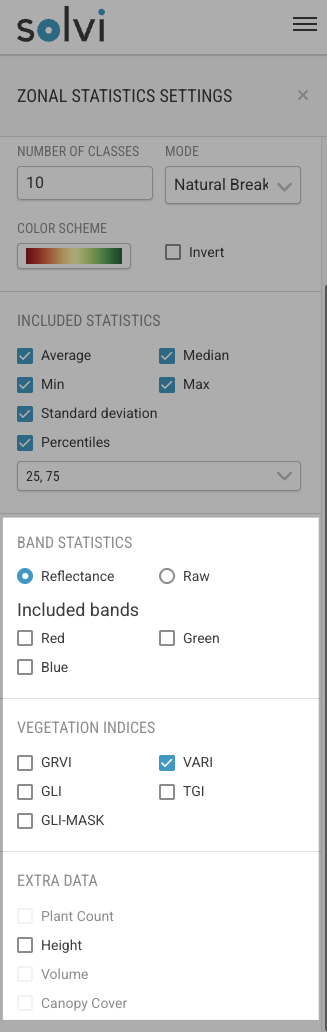
Data Layers
Statistics can be calculated for different types of data layers, depending on the dataset and available inputs.
Reflectance Bands
Depending on which bands your dataset has (**RGB** or multispectral), you can calculate statistics for the raw reflectance values of individual bands.
- RGB datasets include the Red, Green, and Blue bands.
- Multispectral datasets include additional bands such as Red Edge and Near-Infrared (NIR).
The list of available bands will depend on the specific sensor used.
Vegetation Indices
Vegetation indices combine multiple spectral bands to highlight crop health and vigor.
The list of indices available in the settings panel depends on which bands are present in the dataset and which indices are activated for your account.
Both Solvi’s default indices and any custom indices you’ve added will appear here.
Extra Data
Under the Extra Data section, several additional metrics can be selected if the dataset supports them:
- Plant Counts – available when a plant count analysis has already been performed for the same Upload. This allows you to calculate the total number of plants, plant density and other plant-level metrics per zone.
- Height – available when a Digital Surface Model (DSM) or Canopy Height Model (CHM) is present.
- Canopy Cover – available when a vegetation mask has been generated using the Plant Focus tool and the tool is activated. Measures the fraction of each plot covered by vegetation.
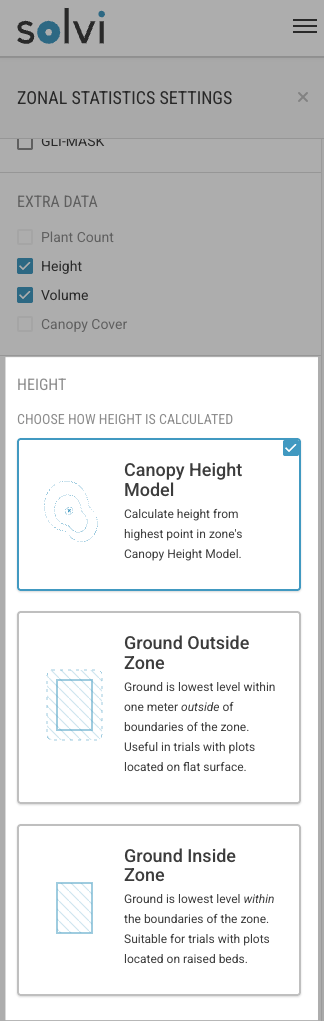
Height Calculation Methods
If you choose to calculate Height, several methods are available:
- Canopy Height Model (CHM) – uses a pre-generated CHM layer as the height source. This method is covered separately in the Elevation Tool documentation.
- Ground Outside Zone – uses the lowest point outside each plot as a reference base for height. Recommended when bare soil is visible between plots.
- Ground Inside Zone – uses the lowest point within each plot as a base. Recommended for raised-bed trials, where you don’t want to include the bed height in the measurement.
Using the Plant Focus Tool for Vegetation Masking
When the Plant Focus tool is active and a vegetation mask has been applied, Zonal Statistics will automatically calculate metrics only on the visible vegetation pixels (i.e., those not masked out).
This is particularly useful for excluding soil or background pixels that could distort vegetation indices.
To return to calculating statistics based on all pixels in each plot, simply deactivate the Plant Focus tool and recalculate the statistics.
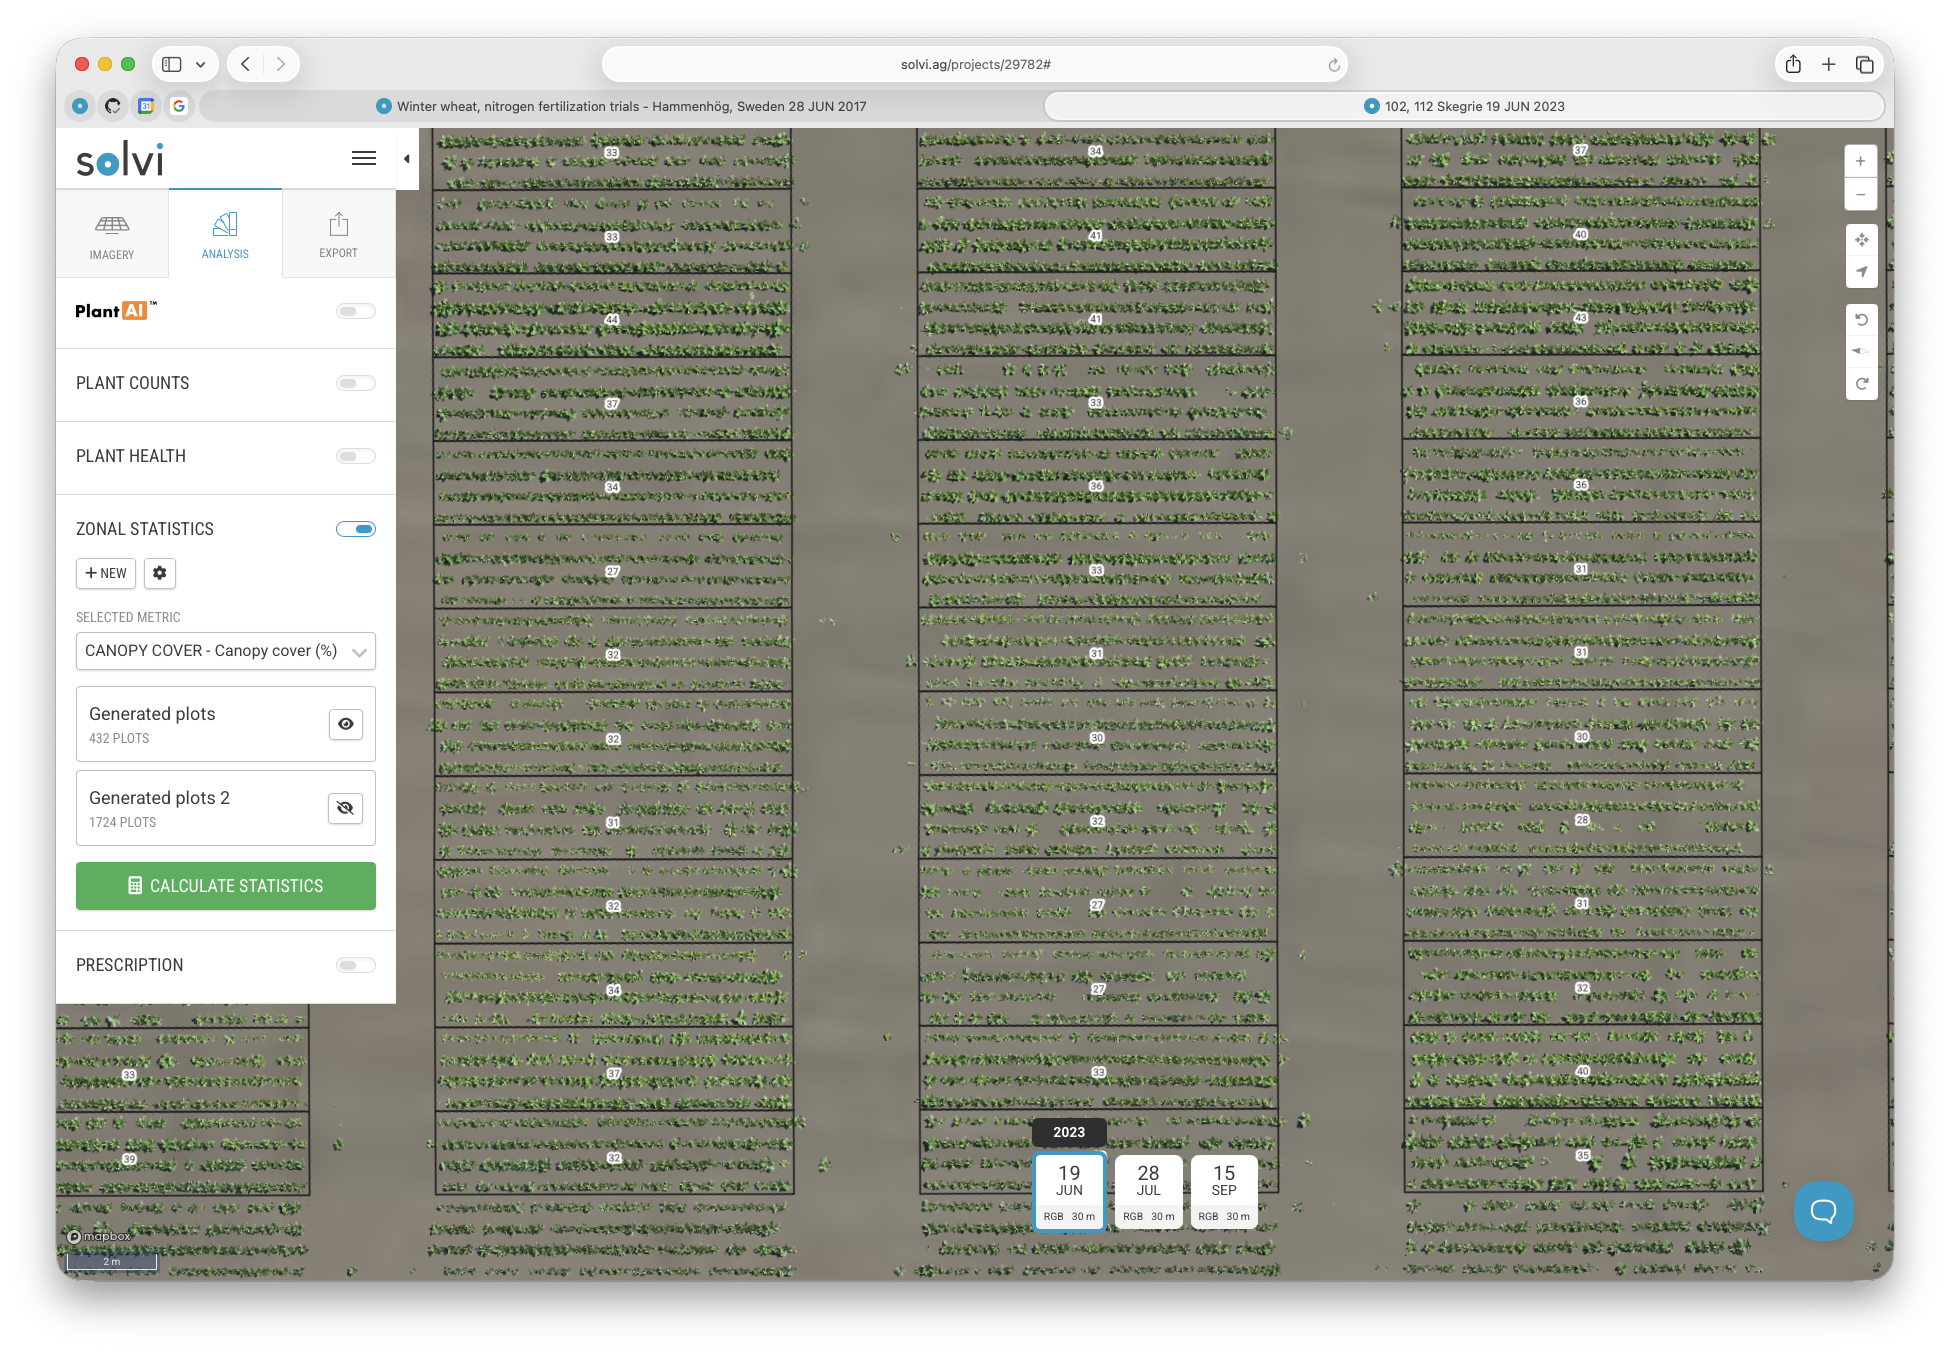
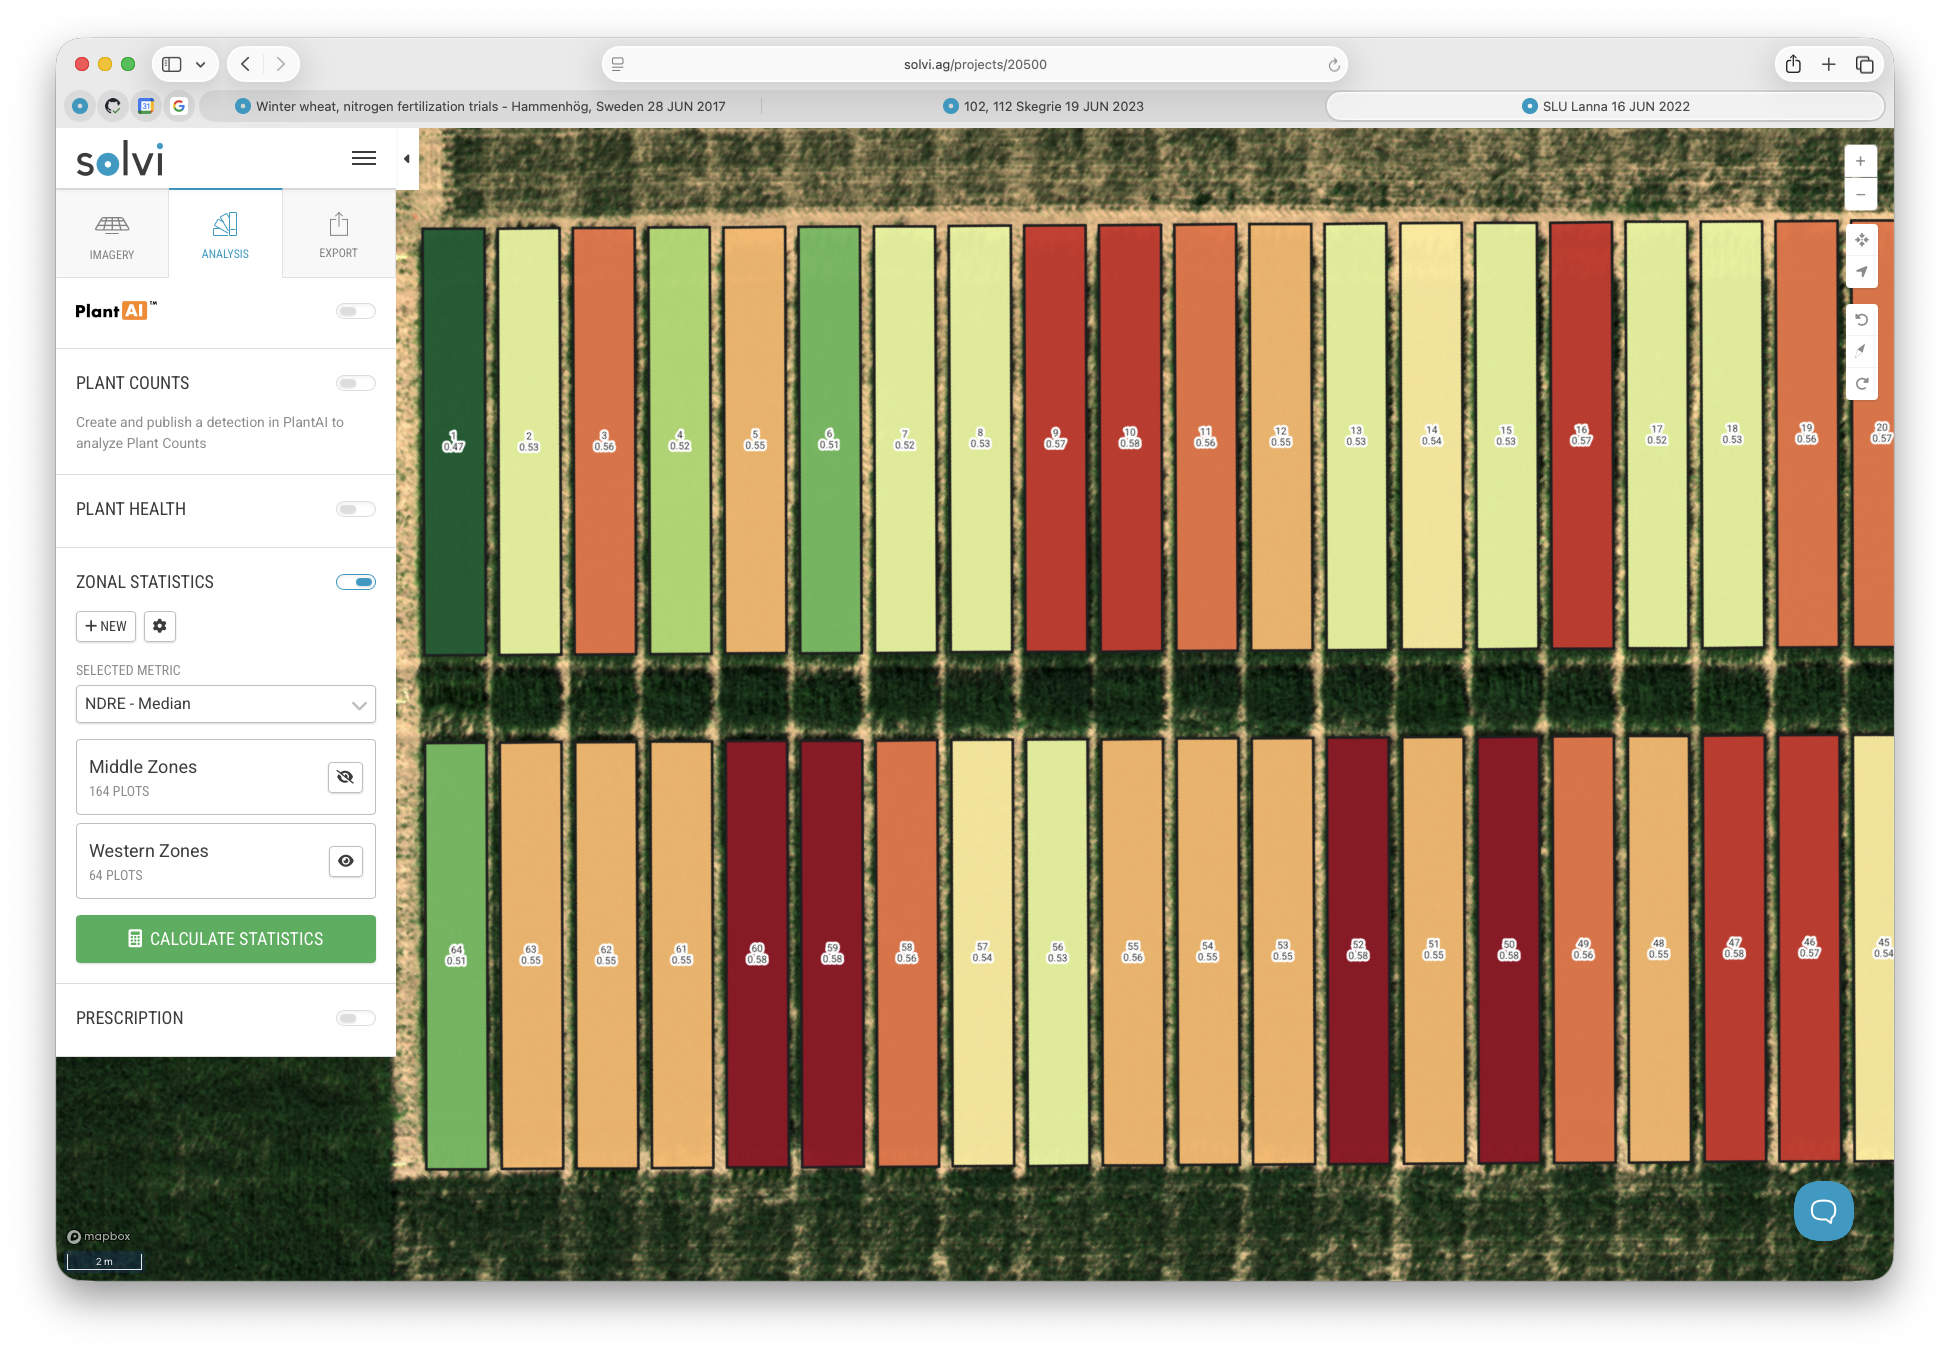
Calculating the Statistics
After selecting the desired metrics and data layers, click Calculate Statistics.
The calculation process will start immediately, and depending on the number of zones, it can take anywhere from a few seconds to a few minutes.
Once completed, results are displayed on the map, ready for review and visualization.