Reviewing and Visualizing Statistics
Selecting a Metric to Visualize
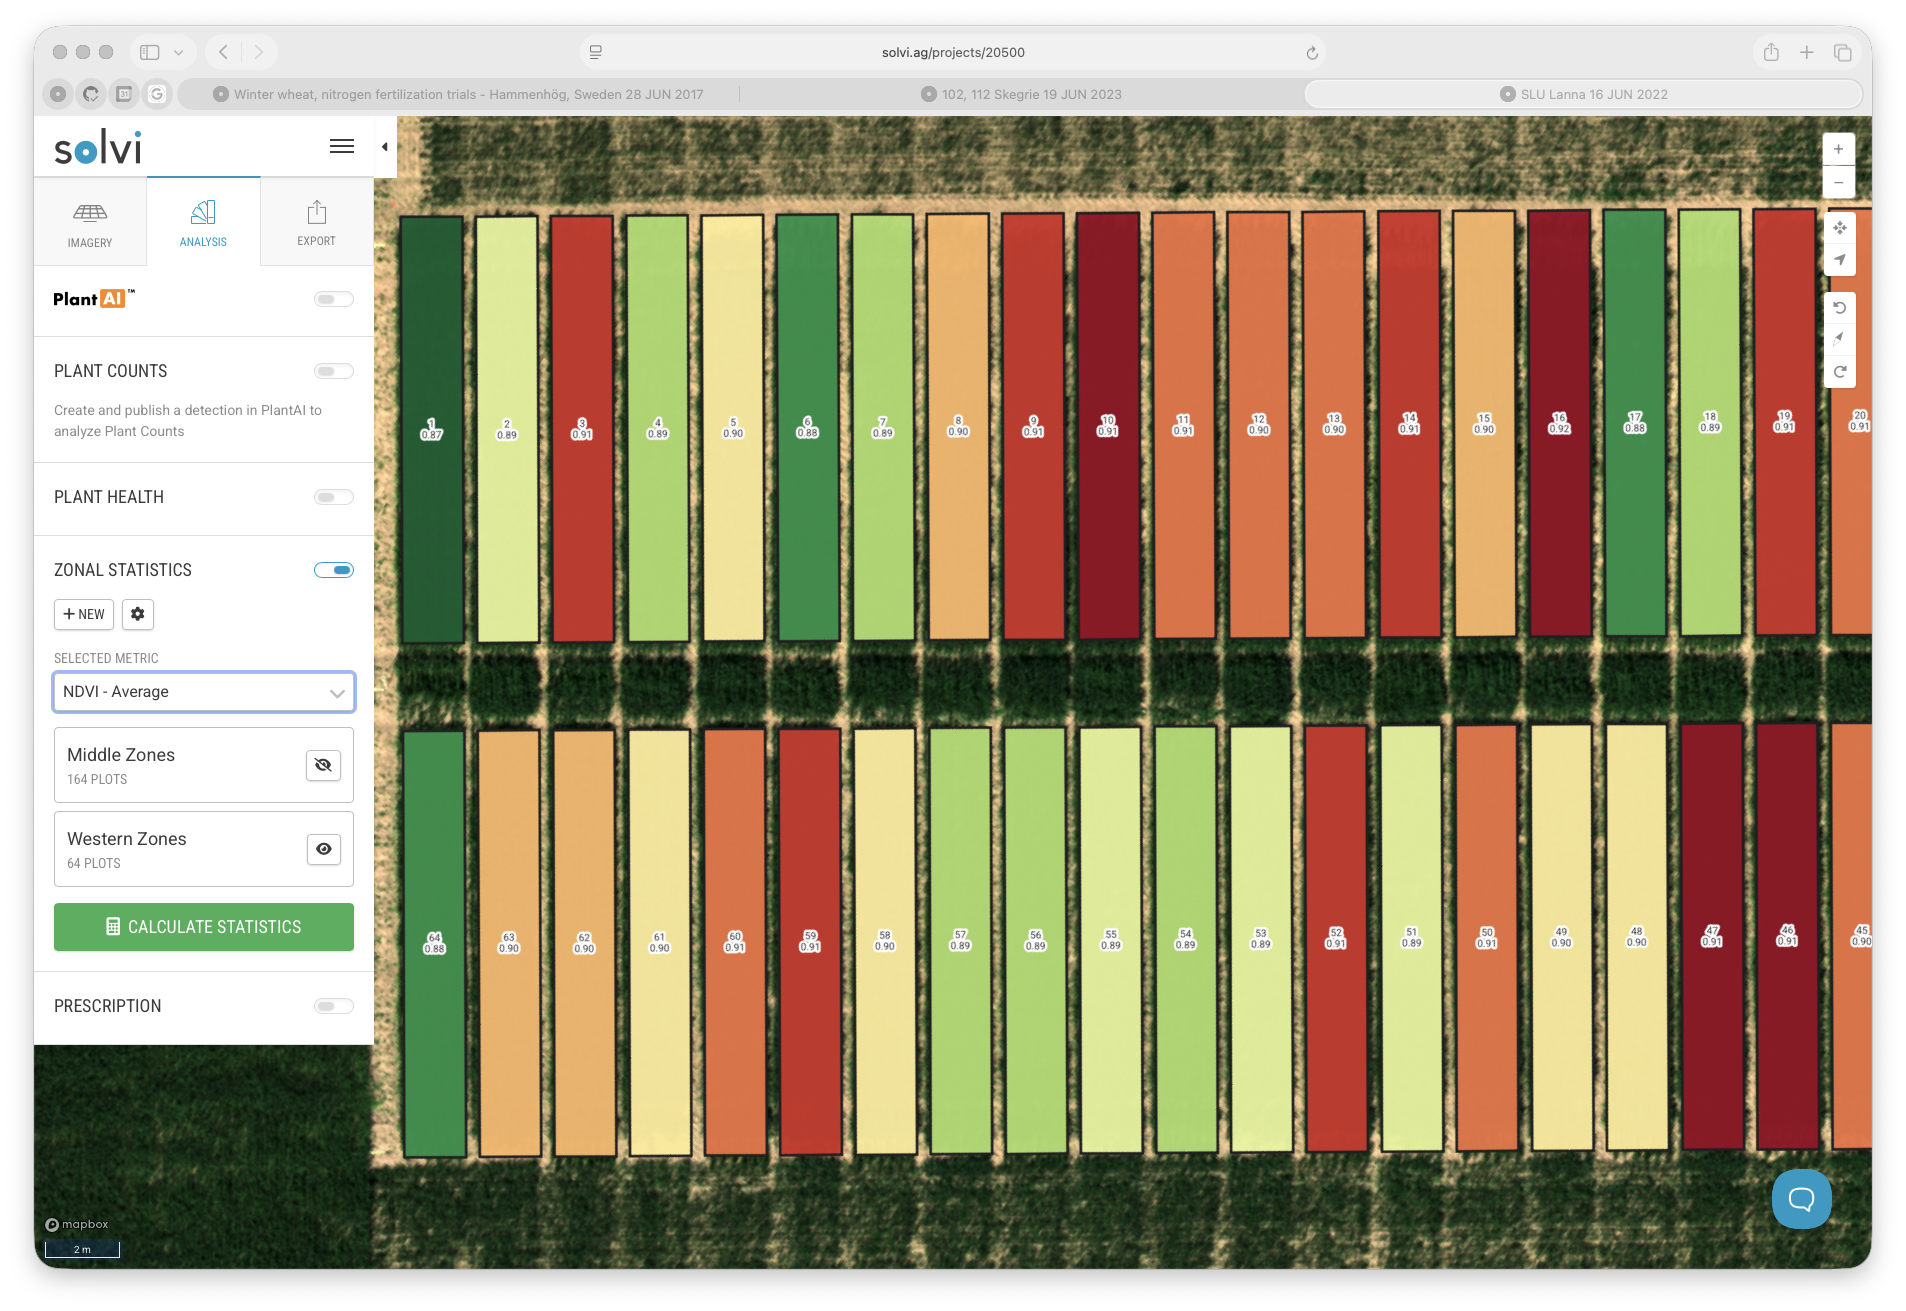
Once the statistics have been calculated, each zone or plot will have values for the selected metrics.
To visualize them, open the Selected Metric dropdown in the Zonal Statistics toolbar and choose which metric to display.
For example, you can view NDVI (average), Height (maximum), or any other calculated metric.
When a metric is selected, Solvi automatically colorizes all plots on the map based on their values. This makes it easy to identify spatial trends, detect outliers, and compare treatment performance.
Display Options
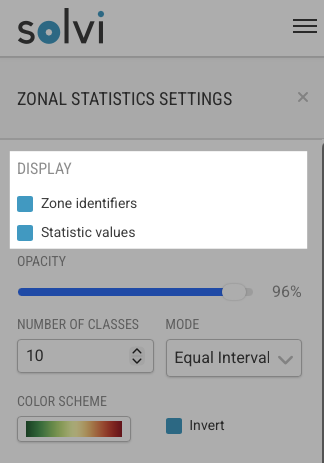
Visualization behavior is controlled from the Display section in the Zonal Statistics settings.
Here you can customize what information appears on the map and how it is styled.
You can toggle the following options:
- Zone Identifiers (Plot IDs) – shows or hides plot labels.
- Statistic Values – shows or hides the numeric values of the currently selected metric directly on the map.
By default, both are enabled.
Classification Settings
Each time statistics are visualized, plots are automatically divided into classes based on their metric values. This classification helps group plots into color-coded categories for easier comparison.
You can customize how the classification works using these parameters:
- Number of Classes – sets how many value groups will be created (e.g., 5, 10, or 15).
- Classification Mode – choose how plots are distributed between classes:
- Equal Intervals – divides the full range of values into equally sized intervals.
- Equal Count – ensures each class contains roughly the same number of plots.
- Natural Breaks (Jenks) – automatically determines class boundaries where value differences are most distinct.
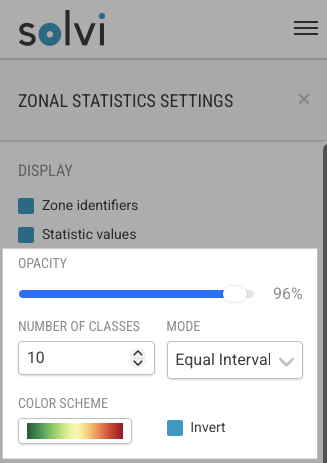
Color Schemes and Opacity
You can control how plots are visually represented on the map:
- Color Scheme – choose between different palettes (e.g., Green–Red, Red–Blue, or Red–Green).
- Invert Colors – reverses the color scale, so that high values use the color previously assigned to low values and vice versa.
- Opacity – adjust transparency from fully opaque to transparent to better view the underlying map.
Color and display preferences are saved automatically for each Upload and for your user profile, so the same visualization style will be applied next time you open another dataset or copy zones to a new Upload.
Classification Across Multiple Zone Groups
If a dataset contains multiple Zone Groups (for example, two separate trials in one Upload), classification is applied only to the currently visible zones.
This means that if you want to visualize two independent trials separately, simply toggle off one group at a time. The classification scale and color legend will then update automatically based on the visible plots only.