Creating Prescriptions Based on Vegetation Indices
Vegetation indices are commonly used to identify spatial variability in crop vigor and canopy development.
Using this information, you can create variable-rate prescriptions to optimize fertilizer distribution — applying more where crop growth is limited and less where vegetation is already strong.
This method is typically used for broadacre crops such as cereals, oilseed rape, or maize, where uniformity and efficient nutrient management are the main goals.
Step 1. Start a New Prescription
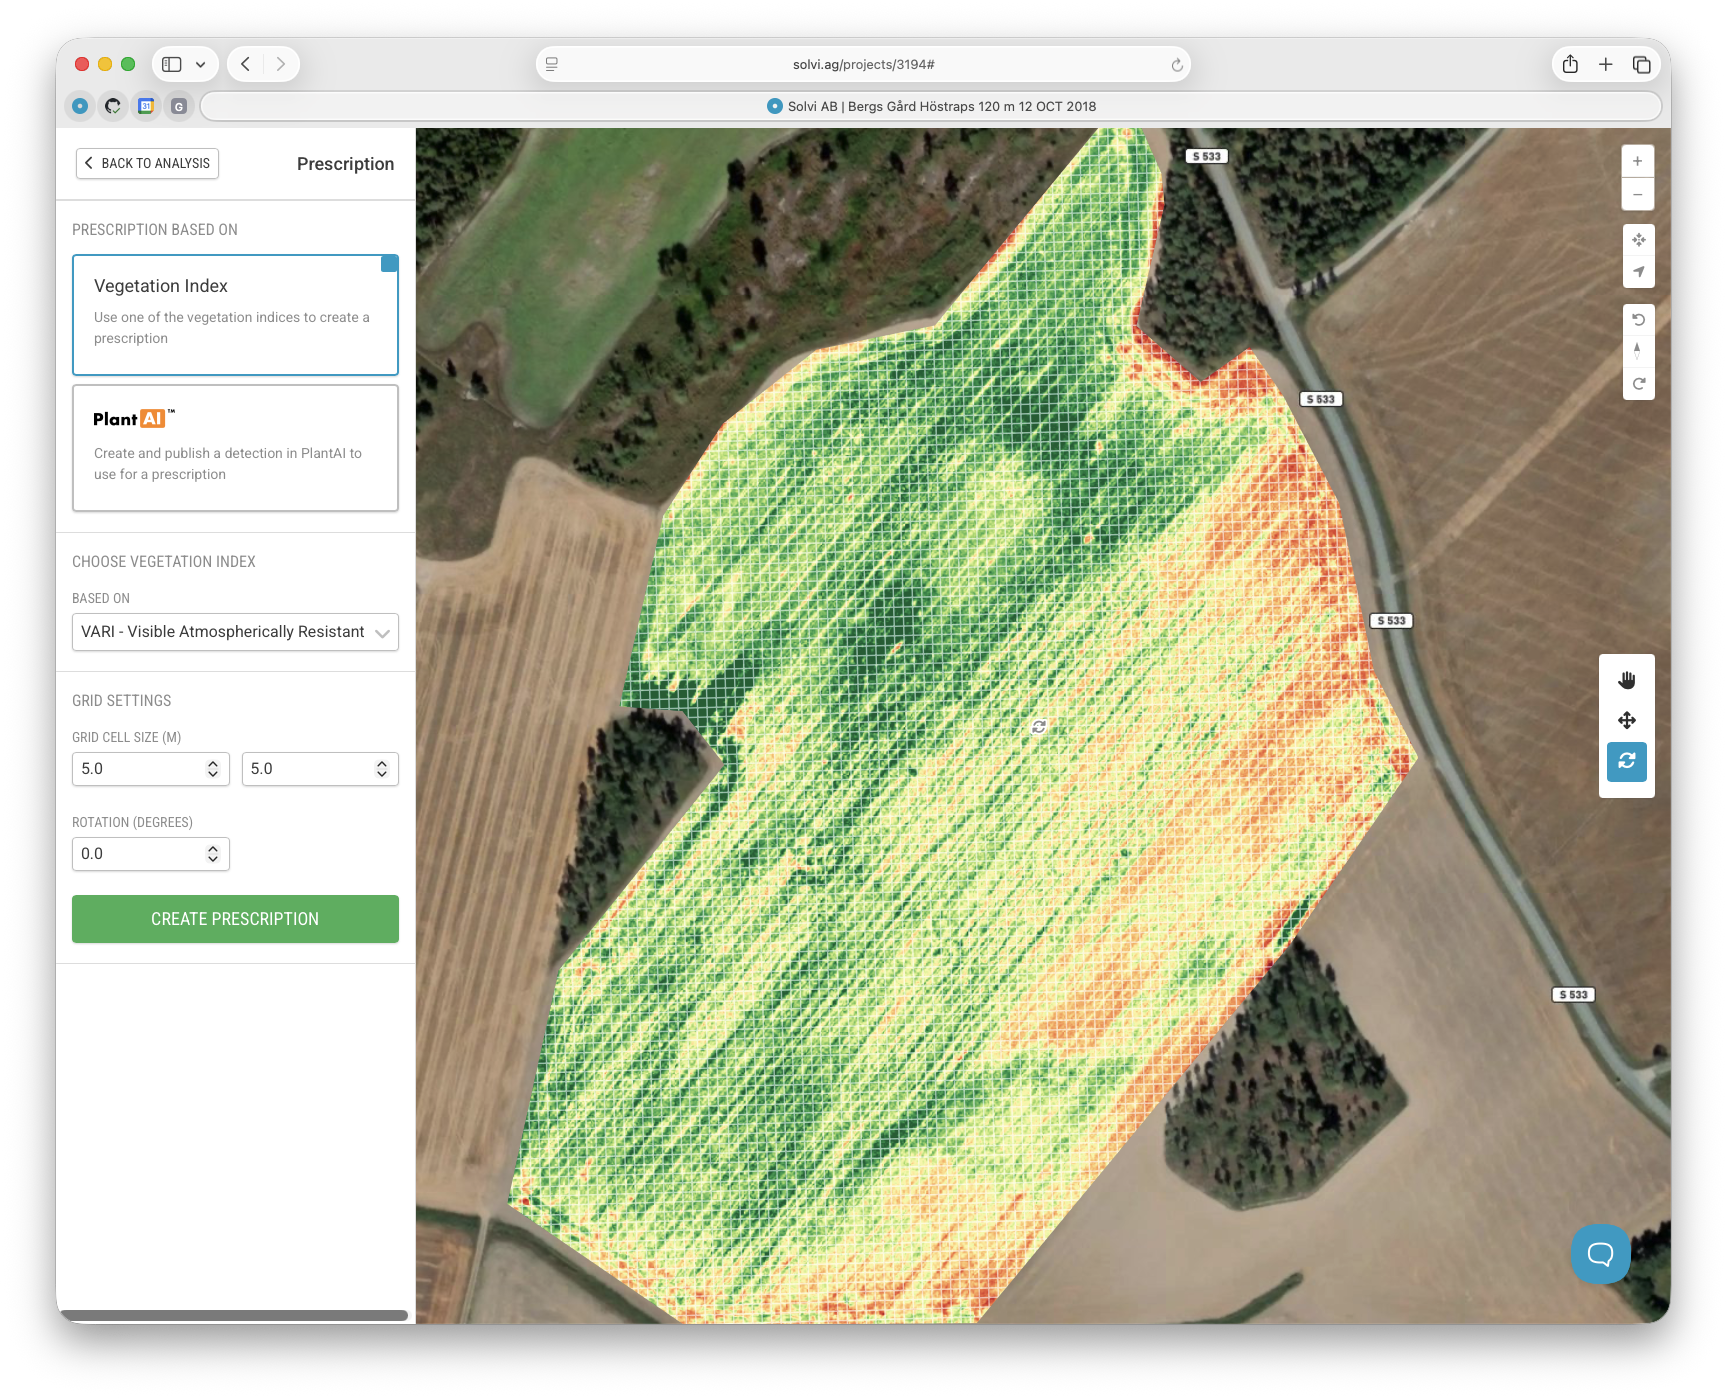
Navigate to the Prescription Tool and click New to create a new prescription file.
In the dialog that appears, choose Vegetation Index as the data source.
This will allow you to use one of the vegetation index layers already available for the selected Upload — for example NDVI, NDRE, or GLI, depending on the imagery type.
Step 2. Configure the Grid
Next, configure the grid that defines how rates will be applied across the field.
The grid acts as the base for calculating average index values and assigning application zones.
You can adjust the following parameters:
- Rotation — Align the grid with the driving direction of your machinery.
- Working width — Match the grid cell width to the implement’s working width (e.g., 24 m).
- Cell height — Define how frequently rate adjustments occur along the path (e.g., every 10 m).
- Alignment — Use the drag tool to align the grid visually with tramlines or field boundaries.
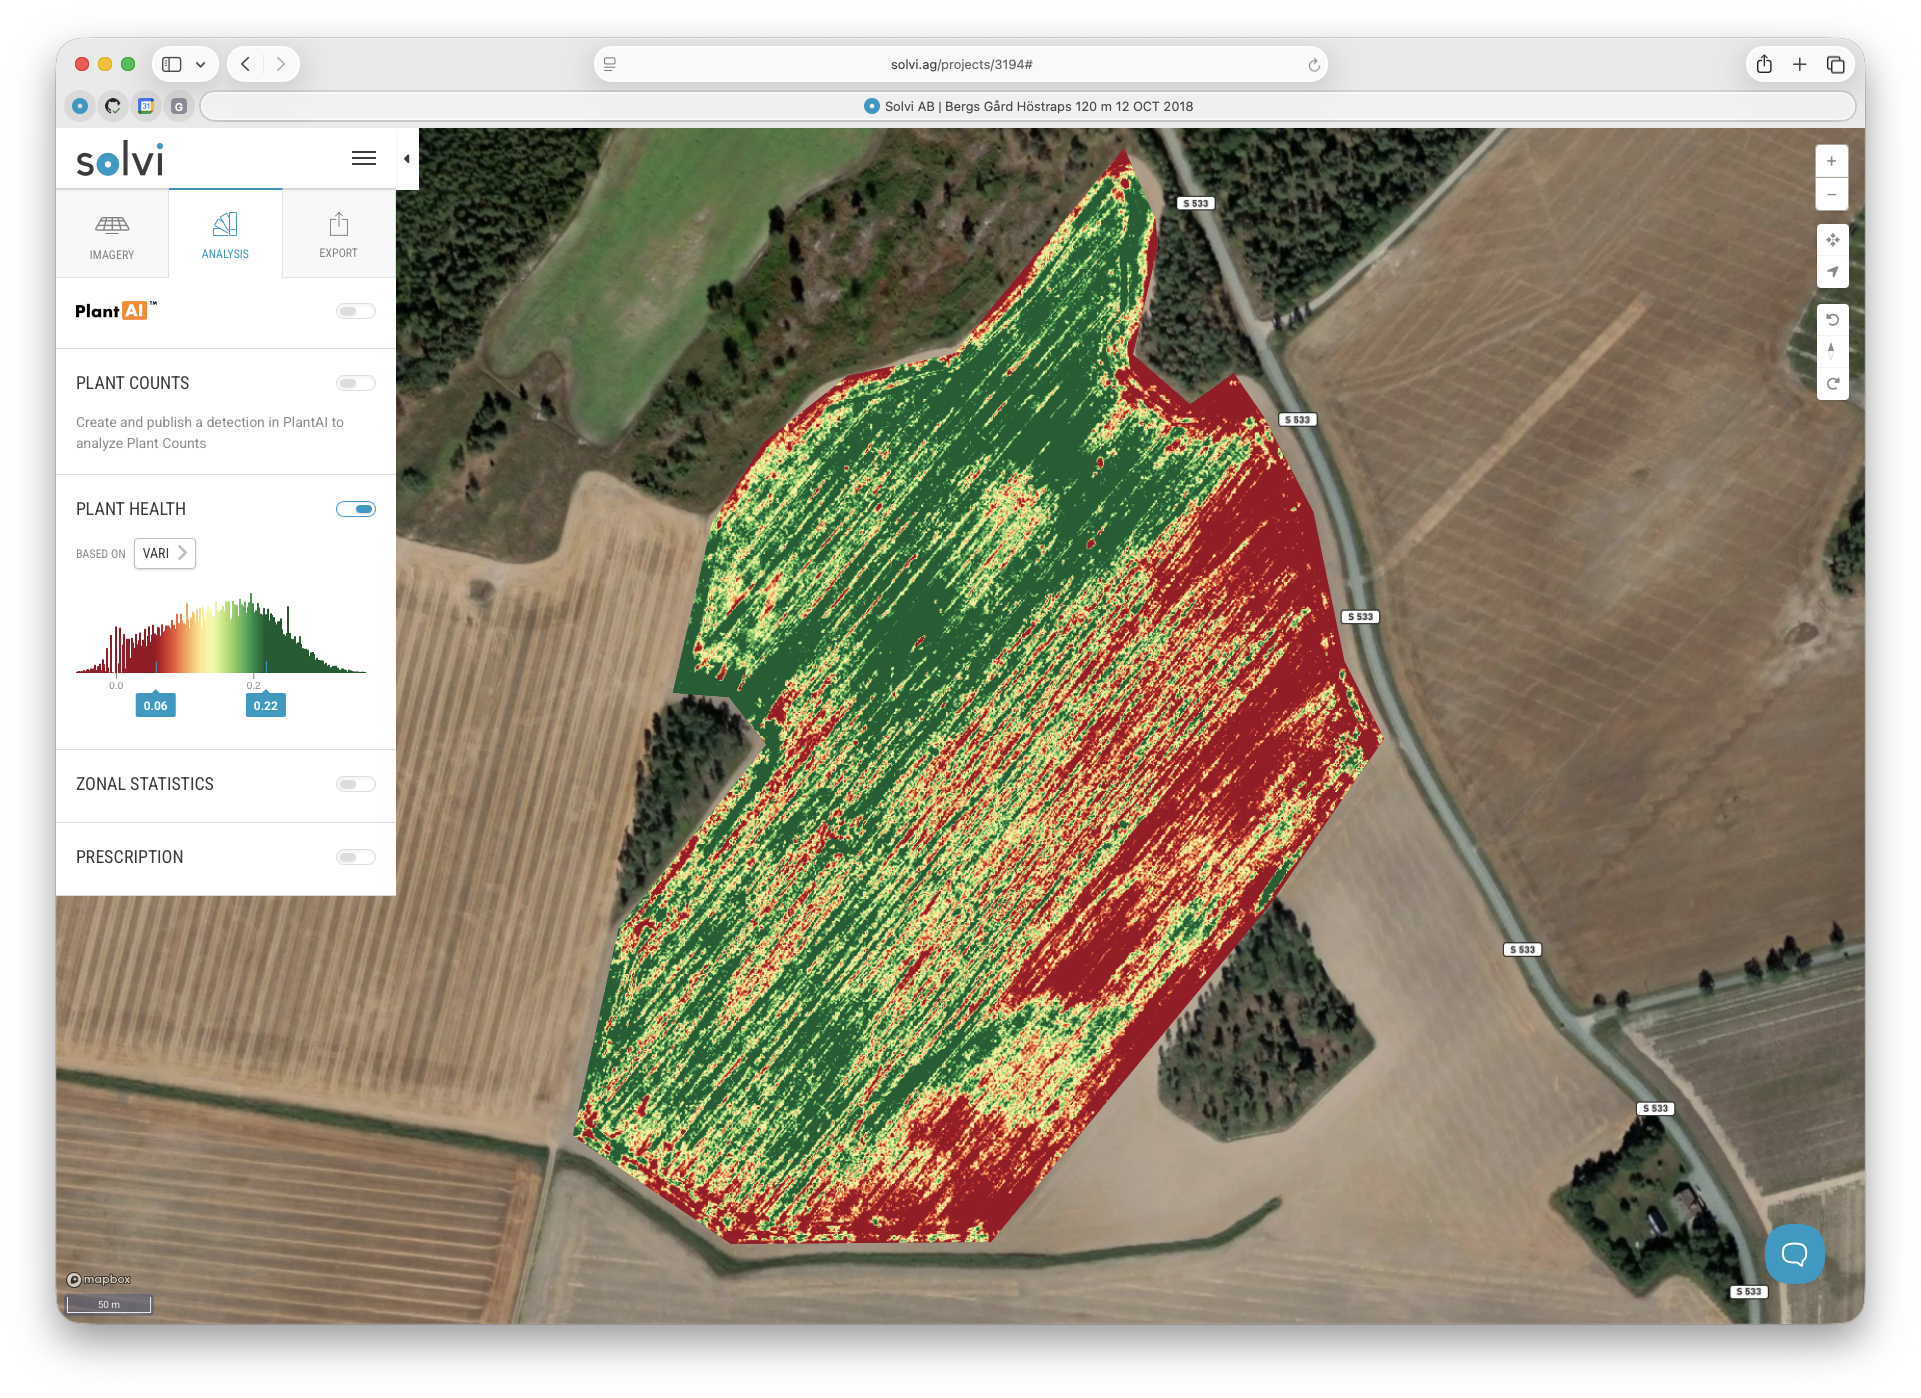
Step 3. Select the Vegetation Index
Choose the vegetation index that best reflects canopy health and crop condition.
- For RGB imagery, indices such as GLI or VARI are available.
- For multispectral imagery, indices like NDVI and NDRE are typically used for fertilizer applications.
After selecting the index, a map will display the spatial variation in vegetation values across the field.
Tip: Curious on how to choose the right index? Learn more on our blog:
👉 Which Vegetation Index Should I Use?
Step 4. Generate the Prescription Map
Click Create Prescription to generate a classified map based on the chosen index.
Each grid cell will be assigned a class according to its average vegetation index value.
By default, three classes are generated (for example, low / medium / high vigor), but you can adjust the number of classes and thresholds manually to refine how zones are divided.
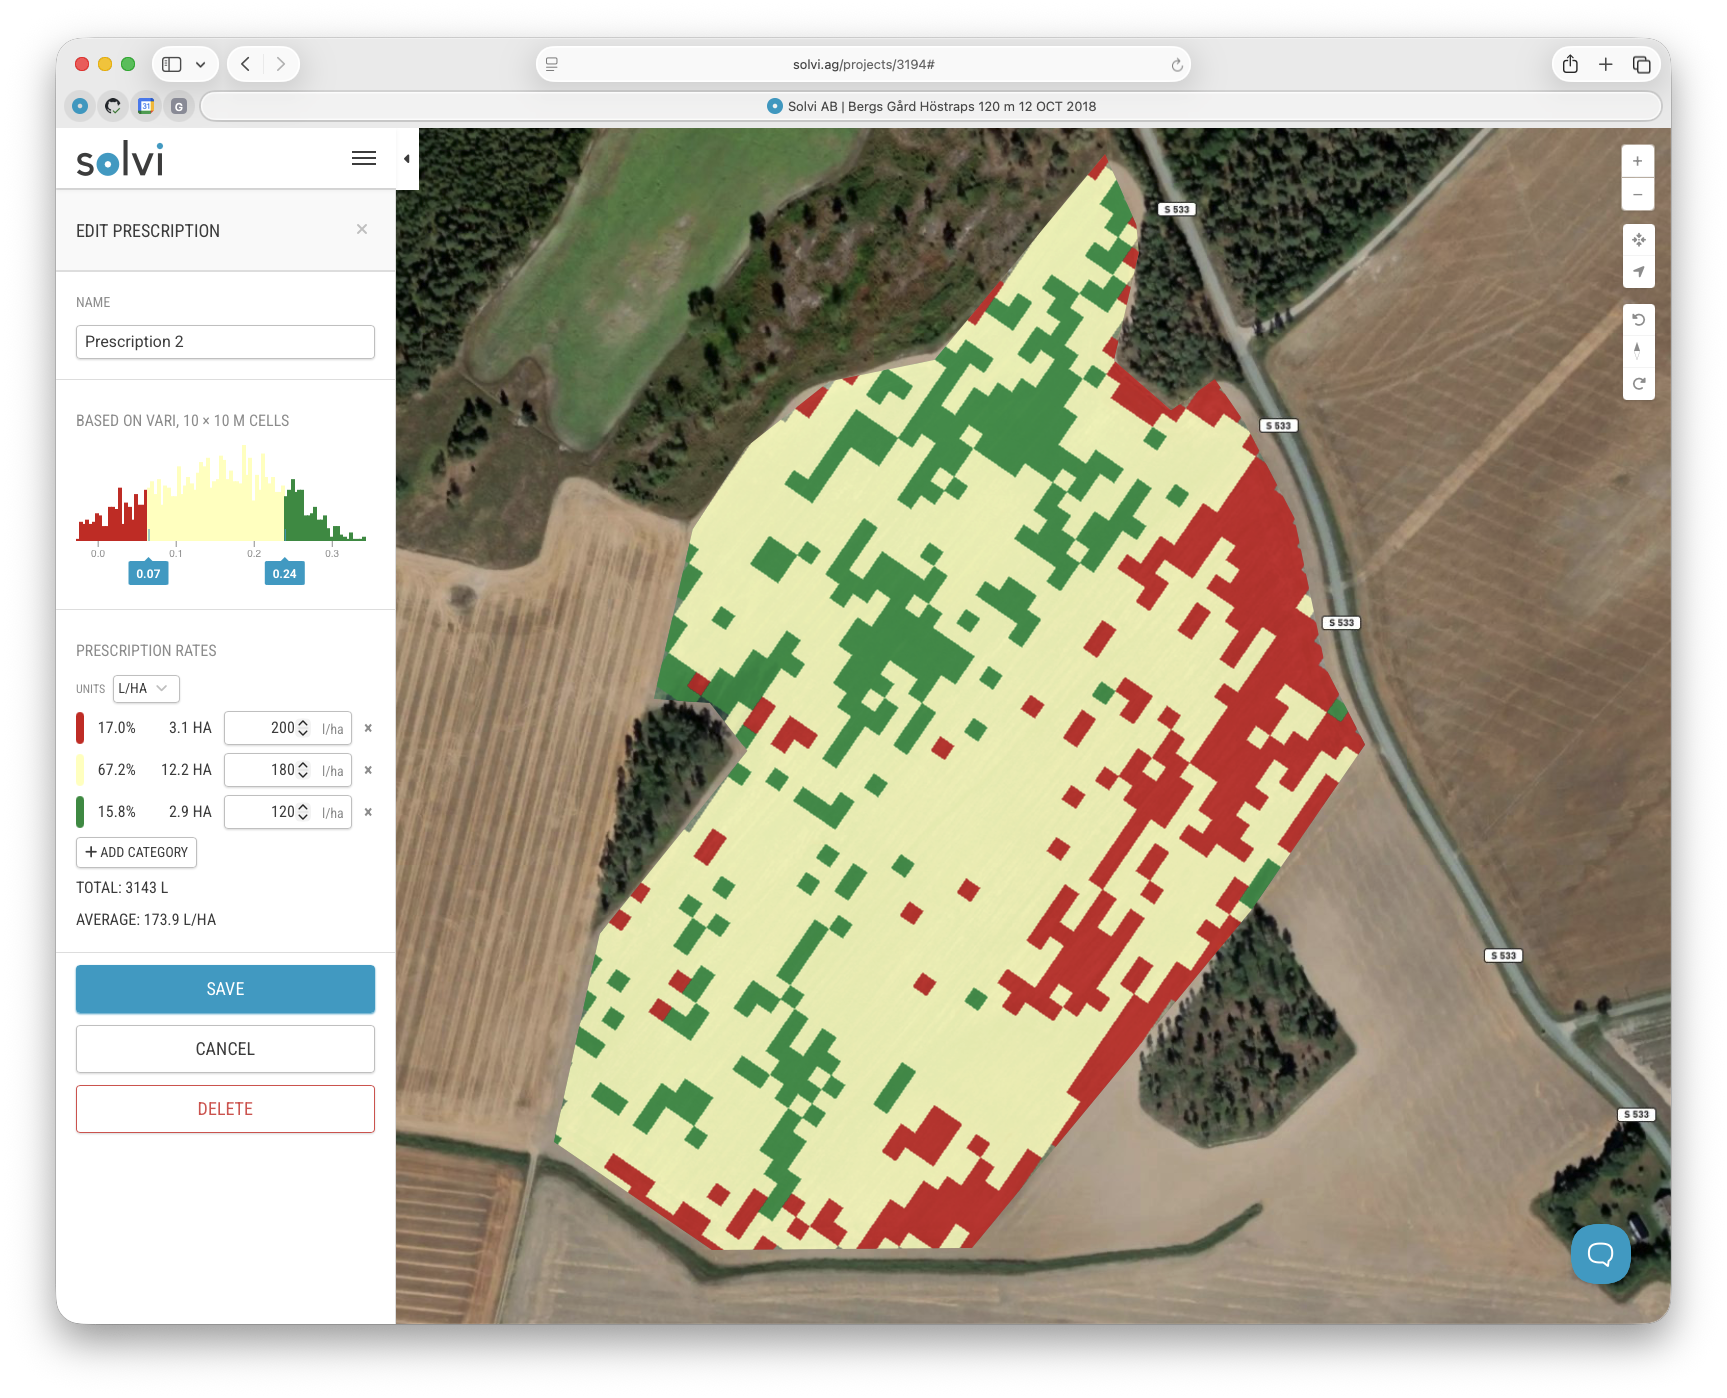
Step 5. Assign Rates
Assign the input rates corresponding to each class.
For fertilizer applications, a common approach is:
- Low index areas → higher fertilizer rate
- Medium index areas → standard fertilizer rate
- High index areas → reduced fertilizer rate
The interface displays a summary of total and average application amounts for the entire field, allowing you to verify that the prescription fits your agronomic plan.
Step 6. Save and Export the Prescription
After rates are set, click Save to store the prescription file.
To download it, open the Export tab and select the Prescription section.
You can export the file in one of several supported formats, including:
- Generic Shapefile (.shp)
- John Deere-compatible format
- DJI Agras drones
- Hardi GeoSelect

Best Practices
- Use the most recent and cloud-free imagery to ensure accurate canopy data.
- Align the grid carefully with tramlines to minimize overlap or gaps during application.
- Use a grid cell size that matches your equipment resolution — too large may miss variability; too small may cause unnecessary file complexity.
- Review total applied amounts before exporting to ensure consistency with your nutrient plan.
With the vegetation index–based approach, you can create data-driven fertilizer maps that improve efficiency and promote even crop development across the field.